Tuesday, April 3, 2018

Cardioid on Hula Hoop

My husband, Link, and I just moved into a new house. It is significantly bigger than our previous place and there were lots of blank walls to fill. I wanted to create a piece for this one section of blank wall in our living room. We mostly have photos and paintings in the room, so I wanted to make something more 3-dimensional and tactile. I had this idea of doing something mathematical with string art. I toyed with the idea of building a set of triangular frames and doing envelopes of parabolas, but found this picture of a computer generated envelope of a cardioid on Pinterest. It seemed really interesting so I dug a little deeper.

Planning

So, according to wikipedia, if you have n points around a circle and you connect every point p to 2*p (mod n), you will create an envelope of a cardioid. (somewhat off topic, but if you switch it to 3*p or m*p, you get m-1 cusps in your curve. More info below). I figured this would make some good string art, but I didn't want to use a different piece of string for every chord. I wanted to use a couple pieces and get as many chords in sequence as I could. I ended up writing a python script (included at bottom of post) using turtle draw to create pictures on n points generating cycles rather than just knowing which two points to connect.
For example, if you have 10 points, you would want the first cycle to be (1, 2, 4, 8, 6, 2) since 8*2 = 16 = 6 mod 10. it ends at 2 since you would continue in a cycle from there. As you see though, we have a problem. Some points are not covered. What about 3? What about 10 (though we will call this 0). We should go back and start again at 3. The next grouping would be (3, 6) We end here since 6 was already covered and we would just loop back into the original cycle. Next we start at 5 since it is the smallest point not yet hit. We get the next grouping to be (5, 0) since 5*2 = 10 = 0 mod 10. If you continue in this manner you get the following groupings and picture:

(1, 2, 4, 8, 6, 2), (3, 6), (5, 0), (7, 4), (9, 8)
Cardioid on 10 points
On 10 points, you don't get enough detail to see the envelope. The pictures get more detailed the more points you add. With 50 points you get the following groupings and resulting picture:

[[1, 2, 4, 8, 16, 32, 14, 28, 6, 12, 24, 48, 46, 42, 34, 18, 36, 22, 44, 38, 26, 2], [3, 6], [5, 10, 20, 40, 30, 10], [7, 14], [9, 18], [11, 22], [13, 26], [15, 30], [17, 34], [19, 38], [21, 42], [23, 46], [25, 0, 0], [27, 4], [29, 8], [31, 12], [33, 16], [35, 20], [37, 24], [39, 28], [41, 32], [43, 36], [45, 40], [47, 44], [49, 48], [50, 0]]
Much better! However, if you see the groupings you will notice that there are a lot of groupings of just two points, meaning they define only one chord. I wanted to lengthen the groupings. Either have just one large cycle or lots of medium sized ones. After testing out a few numbers I arrived at 75 points. You get the following groupings and resulting picture:


[[1, 2, 4, 8, 16, 32, 64, 55, 37, 1], [3, 6, 12, 24, 48, 23, 46, 19, 38, 3], [5, 10, 20, 40, 7, 14, 28, 56, 39, 5], [9, 18, 36, 72, 71, 69, 65, 57, 41, 9], [11, 22, 44, 15, 30, 60, 47, 21, 42, 11], [13, 26, 52, 31, 62, 51, 29, 58, 43, 13], [17, 34, 68, 63, 53, 33, 66, 59, 45, 17], [25, 50, 27, 54, 35, 70, 67, 61, 49, 25], [73, 0, 0]]

I decided on this one since the groupings are all equally sized. There are 8 groupings, enough for each color of the rainbow (ROYGBIV) and one silver. Now that I had the plan, it was on to making this thing!

Making

I wanted something large and I did NOT want to spend a lot of time cutting down and finishing wood, either as a board with a circle of nails or a wooden hoop. So I decided to buy a hula hoop and put nails in around the outside. I wasn't 100% sure this would work since I have never hammered nails into a hula hoop before, but it was worth a shot!

It did end up working out. I measured the circumference of the hoop and divided it by 73. I think I should have been more careful about how I measured the circumference or how I marked out the nails because I ended up with 74 nails in there somehow. It didn't really matter in the end, but if I were to do it again, I would be more careful. Anyway, I marked out my points and began hammering.
As you can see, the hoop I got was not a perfect torus. It was whatever Target had. I liked the metallic color and thought it would go well with the rainbow theme. I also ended up angling the nails so they would disappear a bit when the hoop was hanging up. It also made it easier to loop the string.

Here are some pics of the process:

All ready for the string!
First grouping in red, am I doing this wrong?
Four groupings and you can start to see it
One more to go!
All done!

What happens if you multiply by something other than 2?

When I was writing my program, I was wondering why multiplying by 2 would give you this cardioid and what happens if you multiply by something else? Well here are images on 100 points of different multipliers.
p -> 2p mod n

p -> 3p mod n

p -> 4p mod n

p -> 5p mod n

But why does this work?

Ah, that is the question...
The proof for the Cardioid requires a bit of unit circle trig, but its definitely worth working through on your own. Can you generalize to the other multipliers?

How does this relate to Group Theory?

Also a good question. You are probably thinking, are these subgroups? Why do some numbers generate long strings of groupings and others short ones? Are these orbits under a group action?
Probably orbits, definitely not always subgroups. Might have some quotients in relatively prime situations. I would have to go back to Dummit & Foote to answer for sure. It has been too long...
If you know enough math to even be asking this question, you know enough to answer it for yourself.

Python Code


import turtle 
import math 

RADIUS = 300 

num_points = int(input("How many points?")) 
factor = int(input("What factor?")) 

#generate points list 
points = [] theta = 2 * math.pi / (num_points) 
for i in range(num_points): 
    points.append((RADIUS * math.cos(i * theta), RADIUS * math.sin(i * theta))) 
    #generate drawing sequences 
    sequences = [[1]] 
    finished = False 
    while not finished: 
        # do the appending
        sequences[-1].append((sequences[-1][-1] * factor) % (num_points)) 
        # check if current value is redundant 
        redundant = False 
        for sequence in sequences[:(len(sequences) - 1)]:
            if sequences[-1][-1] in sequence: 
                redundant = True 
                break 
        if sequences[-1][-1] in sequences[-1][:(len(sequences[-1]) - 1)]:
            redundant = True 
        if redundant: 
            finished = True 
            for i in range(1, num_points + 1): 
                new_num = True 
                for sequence in sequences: 
                    if i in sequence: 
                        new_num = False 
                if new_num: sequences.append([i]) 
                    finished = False 
                    break 
print(sequences)  
sheldon = turtle.Turtle() 
sheldon.speed(0) 
win = turtle.Screen() 
for sequence in sequences: 
    sheldon.pu() 
    sheldon.goto(points[sequence[0] - 1]) 
    sheldon.pd() 
    for index in sequence: 
        sheldon.goto(points[index - 1]) 
    sheldon.pu() 

win.exitonclick()

Friday, March 11, 2016

Weather Station 3: Crontab, ffmpeg & Youtube

Some things are up and running. You can check out the pictures and temp data here, but you might only see pictures of my apartment and the temp data is being wonky. All things to fix!

With the hardware complete, I need to wrap up the loose ends with software.

This is what needed to be done:

  1. Schedule all the tasks
    1. Take pictures every 10 seconds
    2. Make a video from those pictures once a day
    3. Clean up and reset for next day
    4. Shut down pi at 10pm and reboot at 5am
  2. Make the video - I'm using ffmpeg
  3. Upload that video to youtube
Clearly some of these overlap, but I decided to figure out Crontab first so I can get the pictures scheduled.

Crontab

You can schedule scripts in linux using crontab. There are countless tutorials online showing you how to do this. Before scheduling anything, be sure to run your script from your home directory as that is where cron starts looking. If you call many other files in your script (as I was doing) be sure to use ABSOLUTE PATHS! Your script will not work if you are using relative paths and your working directory is not home.


Test in home directory:


$ cd /home

$ python /home/pi/Documents/WeatherProject/MainScript.py

If that doesn't work, cron will not work. Fix issues here!

Scheduling in crontab

To open the crontab document, type the following command:

$ crontab -e

You should see a bunch of comments followed by blank space. In the blank space add the following line:

SHELL = /bin/bash

This makes cron interpret your commands as if you were typing them into the bash shell like normal.

Next, schedule the task.

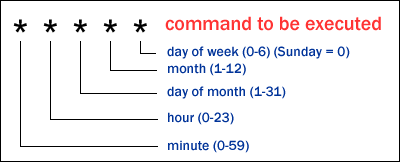
* 5-21 * * * python /home/pi/Documents/WeatherProject/MainScript.py

The normal bash command comes after the asterisks, the asterisks are a sort of clock.
The above command would run every minute of every hour between 5am and 10pm, not including 10pm.

This is how I scheduled the photos, sensor read and uploading to dropbox and google sheets.

As for cleanup, I'm planning on resetting the image number (currently stored, read and updated in a text file), make the video and then delete the day's images. Will post code when it's all working.

I haven't yet scheduled the cleanup or video stuff. I still have to figure out ffmpeg.

ffmpeg

I followed this tutorial to install ffmpeg. It takes a while.

I also followed this explanation for how to use ffmpeg to make a timelapse video from jpg files. It hasn't worked yet, but I'm trying to reinstall then i'll try a few more things. Will update once it works.

Youtube

So I anticipate this being the hardest portion. Once I have ffmpeg working i'll work through this support page from google. One of the changes google made to its API is to have a central developer account so that, theoretically, all of the google apis get routed through the same thing. This ideally will make things easier for me since I already have the oauth2 information in that json file, but I can't really say until its all working. Will update soon!

Weather Station 2: Hardware

I got all the hardware!!! I'm so excited to show this! It came out really well.
Before I get into the nitty gritty of soldering and circuitry... some software stuff changed since I last posted. First, I had to stop using timestamps as the image file names. This is because I am using ffmpeg to make the videos and it expects names like image001, image002 etc. Second, I decided only to upload one image to dropbox and call it current_image.jpg. This ends up working better because then I don't need any fancy javascript on the website end to show the most recent photo. This is what I have so far for the site. So now onto the fun stuff...

Hardware

I followed a portion of the tutorial here, however they fail to mention that you need an additional JST connector, so add that to the shopping list. Here are some pics of the modules and soldering jobs (mostly terrible).
Charger module (best soldering job for this project)
Power Booster (terrible soldering job!)

Solar panel connected to charger module, connected to lithium ion battery


With everything connected:
The finished product!
The charger module does double duty charging the lithium ion battery and dispensing that charge to the booster module. The booster is then plugged into the pi. It all works too!

One part that I totally messed up was the DHT22. I tried to solder the connections together, but did such a terrible job that the connection goes in and out. I have to go back and fix it.
10k ohm resistor between pins 1 and 2

Camera and sensor embedded in tupperware
In order to seal the tupperware from water, I used caulk and hot glue to seal around the DHT22 sensor and around the cable connecting the charging module to the solar panel.
No seal on the cord
Hot glue and caulk to seal the hole

Everything would seem to be working!
Hand held, solar powered computer!!
Hardware complete! I haven't tested how long the charge lasts or how well it charges in cloudy weather.

Now to finish the software portion...

Monday, February 29, 2016

Weather Station

I decided to pick this project up again after it got interrupted by my move to San Francisco. I have a couple weeks between jobs and thought I could get this working in that time frame.
The goal is to make a solar powered Raspberry Pi weather station with accompanying website (available here). The weather station would take a picture of the view from the roof of my apartment building every 10 seconds, posting that picture on the website. Additionally a temperature and humidity sensor would take data and store it on google spreadsheets at the same rate. A graph of this would be visible on the website. At night the Pi would take all the pictures and make a timelapse video of the day, upload that to youtube and that video would display on the front page of the website.
 A lot to promise!

Today's post is a bit dry as it is entirely code, but if you are interested in doing something similar yourself, it will be useful.

As of today, I have code that can...
  • take data from the temperature and humidity sensor (Available Here)
  • write data to google spreadsheets
  • take a picture with the picamera
  • store that picture on dropbox

I am working on writing code to...

  • take a set of jpeg images and create a .mov (hopefully using ffmpeg)
  • upload that .mov to youtube
  • managing the images (will delete each day's pictures from local storage)
  • schedule everything using crontab

I will get to writing the code for...

  • the entire website
  • managing dropbox's images (I would run out of space in about 10 days without managing storage).


So I'll start by documenting what I have done.


Interfacing With The DHT22 Sensor

This took a lot of trial and error. I ended up finding this tutorial and, while the website looks ridiculous, it worked like a charm!

Bash commands / packages to install:

sudo apt-get install git
cd ~
git clone https://github.com/adafruit/Adafruit_Python_DHT.git
cd Adafruit_Python_DHT
sudo apt-get update
sudo apt-get install build-essential python-dev
sudo python setup.py install


Python code:

import Adafruit_DHT as dht 
import datetime 
h,t = dht.read_retry(dht.DHT22, 4)


Writing Data To Google Sheets

First, create a spreasheet where your data will sit. Delete all but one row (there are only 1000 rows so if you delete rows 2-1000 you will be left with only the first row).

Next is a bit tricky because while Google updates its APIs regularly it doesn't, apparently, always keep its documentation up to date. I followed google's own documentation (found here), but ran into problems. Two hours later, I found the solution here.

So, if you are doing this yourself, follow the google tutorial, just replace the python in step 6 with what I have below (with certain things replaced to refer to your own project, of course).

Bash commands / packages to install:

pip install PyOpenSSL pip install --upgrade oauth2client

Python code:

import json
import gspread from oauth2client.service_account 
import ServiceAccountCredentials 

#The following refers to the json file created by google. It must be placed in the same directory as this script.

json_key = 'WeatherStation-41a4ca0f181e.json' #replace with your own

scope = ['https://spreadsheets.google.com/feeds']

#this service account credentials part was what was not documented.
credentials = ServiceAccountCredentials.from_json_keyfile_name(json_key, scope)

gc = gspread.authorize(credentials)
sht = gc.open('WeatherStationData') #the name of the spreadsheet
wrksht = sht.worksheet('Sheet1') #the name of the worksheet

wrksht.append_row([datetime.datetime.now(), t, h]) #append the data


Picamera

This is well documented and easy to use. All information can be found here.
I chose to use the date and time as the file name for a couple of reasons. One is that the pictures have a lot to do with time, so if I ever need to find one taken at a particular time, I search by file name. The other reason is that the date and time is always unique so I know I won't have any file naming errors.
However, if you do use datetime.datetime.now() you have to do two things:

  1. Change the date and time of your pi to local time from Universal Time (for your convenience and sanity)
  2. Replace all strange characters like ':' with '_' so you make sure you know the naming format
I did a little more with naming and replaced all non-numeric characters with '_' and removed the sub-second digits as they were not necessary for this project.

Bash commands / packages to install:


Enable picamera
sudo raspi-config


Change date and time
sudo dpkg-reconfigure tzdata


Install picam library
sudo apt-get update
sudo apt-get install python-picamera


Note: This is for python 2.7. If you want to use python 3, read the tutorial.


Python code:

import picamera 
import datetime 

#define filename as year_month_day_hour_minute_second.jpg
temp = str(datetime.datetime.now()) 
print temp file_name = '' 
for char in temp: 
     if char == ":" or char == "-" or char == " ": #want to replace all with '_'
          file_name += "_" 
     elif char == ".": #exclude fractional seconds
          break
     else: file_name += char
file_name += ".jpg" 

#take picture 
camera = picamera.PiCamera() 
camera.capture(file_name)


Storing Picture on Dropbox

This takes a little extra than just the dropbox api. This tutorial walks you through the entire procedure in painful detail. So painful, in fact, that I won't rehash it here.

Bash commands / packages to install:


Read the tutorial!

Python code:

from subprocess import call
photofile = "/home/pi/Documents/weatherprojects/Dropbox-Uploader/dropbox_uploader.sh upload /home/pi/Documents/weatherprojects/{} {}".format(file_name, file_name) 
call ([photofile], shell=True)


That's all for now!

Thursday, January 14, 2016

Iron Pipe Shelves


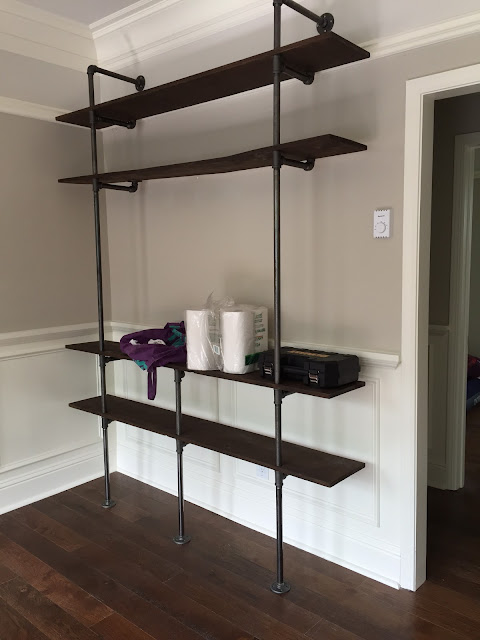
This one was fun! My husband and I moved to San Francisco back in July 2015. We got our current apartment in August and it was a major downsize from our place in Chicago. It has a grand total of 450 square feet and very little closet space. Since I have so much craft stuff, I really needed a place to store it all (I was definitely not about to throw it all out!!!) I started looking on Pinterest for inspiration and came across a ton of posts of industrial shelves made using cast iron piping.
My main inspiration was this picture below:
I decided to also make it a media stand. This way it could house the tv, speakers, receiver and all my craft stuff!
Here is the finished product (on the right):

I took a ton of pictures of me making it, but I seem to have lost them in transferring to dropbox from my phone. EDIT: My mom found some that I sent her!!!
Here is an overview of my process:
Planning out the footprint
building it from the bottom up!
  1. Find the studs. This shelving unit is only secured on the top so it needs to be very secure. I got a stud finder and marked out the studs on the wall.
  2. Map it all out. I decided to have two large shelves on the bottom for craft storage then two smaller shelves on the top for displaying knickknacks and books. I kept the middle for the TV and speakers (although it was only by sheer luck that the speakers fit!)
  3. Buy the pipes. I got 3/4 inch pipes because they were cheaper than the 1 inch. I think it looks good. One thing I didn't totally anticipate was that the shelf spacing is actually longer than the pipe length. This is because the joining pieces have some height to them. Keep this in mind when deciding which pipes to buy. Also note that there are supports underneath each shelf. It is easier to see on the upper shelves. I also added a middle support on the bottom. This is because I put a TV in the middle and thought it should have an additional support.
  4. Drill holes in the shelves. These holes need to be mapped with the studs in mind. This is where the pipe will be threaded through.
    The wood all stained
  5. Cut, sand, stain and finish the shelves. If I were to do it again, I would have bought thicker wood. I think 2inch would have given a nice chunky look to the unit. I do like the dark stain I chose. It really fits with the rest of the apartment.
  6. Build from the bottom up. It isn't very stable at first, but it comes together at the end. Have patience!
  7. At first, I didn't have the top shelf, but it didn't look right
With the top shelf

Anyway, I really like the shelves (even though one of them is a little warped). We definitely would have been swimming in yarn if I hadn't built it!

Friday, December 18, 2015

3D printed food mold

More on this 3D printing kick...

I have been assistant coaching the math team at my school for the past year and a half and found out that our team has an unofficial mascot: Metoo!
Metoo is a Malasian toy line that has everything from plush toys to pencil cases and backpacks!

Anyways, I set out on an interesting mission. I wanted to make a jello cake in the shape of metoo. I did try to redesign metoo on sketchup, but it wasn't looking right. I could probably do it in tinkercad now that I have more experience, but whatever. I decided that in order to look exactly right, I would have to 3d scan metoo.

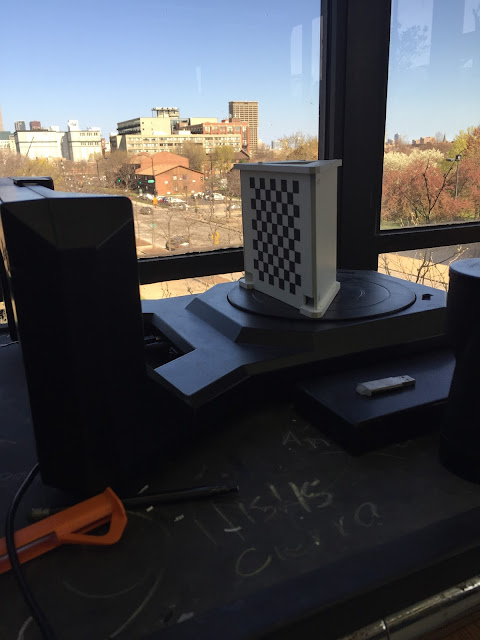
Makerbot Digitizer:
A colleague of mine in the science department at my school has a makerbot digitizer. He has never successfully used it and I am pretty sure I know why. The makerbot digitizer is an optical 3d scanner that relies on offset lasers and an optical camera to create the 3d image of your object. This means that the scanner is highly sensitive to light. The scanner should be operated in a well lit environment with NO CHANGES to the lighting. Here was my first attempt at scanning:
Beautiful view, not good for scanning

This turned out horribly
So, I learned my lesson. This scan looked like a hot mess. My second line of attack was to "borrow" the 3d scanner and take it to a more stable location. The second scan was significantly better, but with the setting sun coming through the windows, I still had the odd random blob show up in the final scan. So I tried another method.

Kinect:
I coach the robotics team at my school and we somehow managed to get at X-Box Kinect as a donation. I found it down in our robot room and brought it up to the computer lab. The scans on skanect were awesome! However, the premium version of the software is both necessary to edit/export and extremely expensive. I looked at a few other pieces of software but ended up abandoning this path as well.

With no other way forward, I went back to the makerbot digitizer. I came in before school, scanned the image with minimal changes in light and it came out ok.  The metoo was slightly deformed, but ok.
The deformed metoo scan
I had wanted to edit the metoo scan so that he didn't print all deformed, but I couldn't find a good way to get at the file. For being at the center of the maker movement, makerbot is not very tinker friendly. I would really appreciate some more openness to their software.

After finally getting a scan I could use, I printed it! I fixed up the strange bits with some tape so at least the mold would turn out well.

I got some food grade silicone for molding. I had to kneed it for a few minutes to mix the two putties. Then I pressed it around the rabbit. I was a little worried that the silicone wouldn't hold its form, but that stuff was STRONG!

Waiting for the silicone to harden

With the bunny model removed
When I removed the rabbit I nearly broke off the ears! also, there were some holes in the bottom, but that didn't turn out to be a huge issue.

Now for the final step! White Chocolate Bunny Time!

Melting the chocolate

greasing up the mold

Pouring the molten deliciousness

Waiting for the chocolate to cool
All done!
I have definitely learned a lot from this experience. If I did it again, I wouldn't push the silicone so high up the sides of the model. It made getting the chocolate out very difficult.
Hope you enjoyed!


Tuesday, June 16, 2015

Seifert Surface 3D Print

Seifert Surface on Trefoil

Today's adventure is printing a Seifert surface on a trefoil knot! I'm sure you all know what that is (\sarcasm) If you want to know more about this surface, there is an explanation at the end.

When I was a first year in college, I did an independent study on knot theory and really loved it. For that project I made a model of Seifert surfaces on both a trefoil and figure 8 knot out of a wire hanger and panty hose. I wish I still had a picture. I have always wanted to carve a larger, more sturdy version out of wood, as a tiered cupcake stand. I got one step closer to this goal today; I 3D printed the thing!

When I read this post by Laura Taalman and Jonathan Gerhard, I realized I too could 3D print these surfaces! Laura and Jonathan used a wonderful program called SeifertView to model the surface of their knot. I downloaded it and got it running on my mac through wine bottler.  This program is so much fun! Check out some screen shots:

Trefoil Surface in SeifertView
Close Up
Laura and Jonathan did get a special version that would export to stl (although I only ever got it to export to .obj) in order to 3d print the surface. Clearly I needed this special version of SeifertView as the original doesn't have many export options. So, without ever meeting either of them, I emailed Jonathan (thinking it was Laura, I guess I didn't read the post that closely) and asked for it. He responded within a few hours! 

I then followed the suggestions from Jonathan and brought the .obj file into blender, and thickened the mesh using the solidify tool (here is an awesome tutorial on the tool) and exported as .stl.

Blender


From there I imported into makerware and printed! (thingiverse)
In Makerbot Makerware
Printing with rafts and supports. 0.3mm, 10% infill
Final Product! Would print at 0.2mm next time


About the Surface:
A knot in mathematics is not so much like the knot you tie on your shoe laces, rather it resembles more the knots of celtic art work. In fancy terms, a knot is an embedding of a loop in 3 dimensional space. An "untied" knot is just a circle. The simplest knot you can make is the trefoil. Here is a drawing of one:
Trefoil Knot
A knot surface is a surface whose boundary, or edge, is a knot. So for the unknot (or circle) the knot surface is a disk. The interesting question here is, what would a surface look like if its boundary were a knot. One option for a surface whose boundary is the trefoil knot is a strip with three half twists (pictured below).
Surface on Trefoil
The problem with this surface is that it has only one side! If you were an ant, placed on this strip, you could walk in a straight line and eventually end up under where you started without ever crossing the edge. See Vi Hart's video for more explanation.

The question remains: does every knot bound a surface that has two sides? Herbert Seifert found a solution to this problem. He devised an algorithm that would define a two-sided (orientable) surface on any knot!

The culmination of this one quarter was proving that the Seifert surface on a trefoil knot is isomorphic to a punctured torus. It would be really cool if I could somehow print the steps in the dissection proof... A project for another day.
Punctured Torus